


WRITTEN BY ROHIT KODANCHA
Did you know that we can recycle everything from asphalt, water, lead, plastics, bottles, concrete, e-waste, metal, wood, paper, and cardboard? While waste recycle helps reduce costs for companies, the most significant benefit is reducing raw materials usage and waste and limiting the enormous and often irreparable damage caused.
Plastic is a persistent material. Once disposed of, it does not go away but takes centuries to degrade. For example, one single water bottle can remain on the planet for around 450 years. ‘Lead’ is another hazardous waste; its disposal poses both health and environmental threats. However, 100% of lead is recyclable, so recycling of lead helps reduce disposal and is highly energy efficient as you don’t need to mine it from the earth again.
The statistics on recycling in India show that companies are yet to take any significant waste and water recycling measures. Of the 300+ companies reviewed, we find that a little over 100 have strategies to reduce overall raw materials use or promote recycled materials. In this study, we review company strategies on recycling, waste, and water.
WASTE AND WATER RECYCLING
AVERAGE OF WASTE RECYCLED AS A % OF TOTAL WASTE GENERATED IN THE YEAR
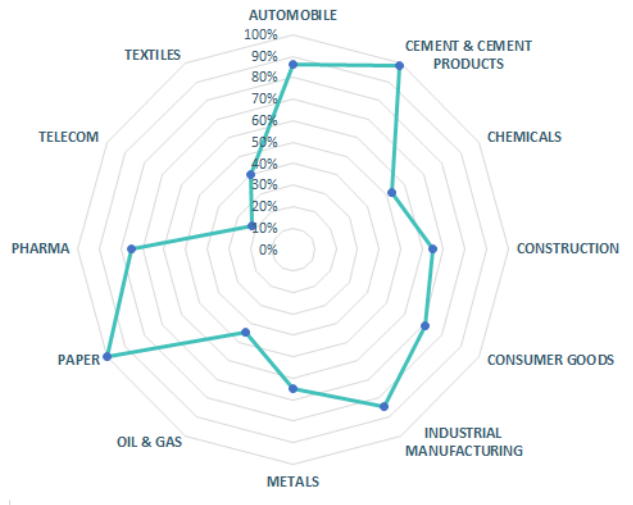
Only ~10% of the Top 300 companies disclose the percentage of their waste recycled. In the companies that make their data public, over 71% of the total waste generated gets recycled.
Paper and Cement are the leaders with close to 100% of their waste recycled, followed by Automobiles and the Industrial manufacturing sector, which stands at a high 85%.
The Telecom sector generates much e-waste, but their recycling levels are abysmally low at 22%. The textiles industry, with a 40% recycling percentage, needs to increase its efforts.
When it comes to water reuse or recycling, only 15% of the top 300 companies disclose numbers; the overall percentage of water recycle across industries is only 37%.
AVERAGE OF WATER RECYCLED AS A % OF TOTAL WASTE GENERATED IN THE YEAR
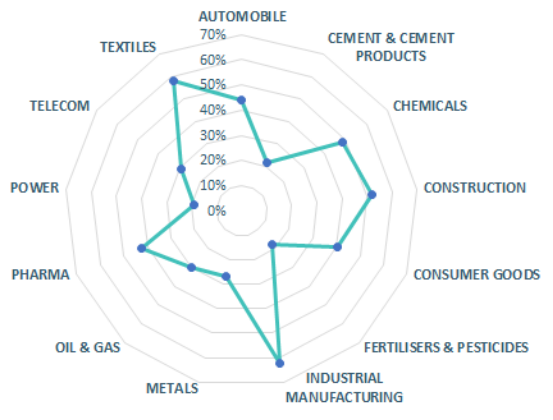
Industrial Manufacturing and Textiles are the leaders in water recycling with 63% and 58% water recycled, respectively. Textiles consume a vast amount of water; for instance, to produce a kilogram of fabric, typically 200 liters of water is consumed in washing the fiber, bleaching, dyeing, and cleaning the finished product. The wastewater generated during these processes is highly polluted and often discharged into water bodies without appropriate treatment, disturbing aquatic life and millions of people dependent on water for their day-to-day life. Hence, a 58% recycling or reuse is still low for the textile industry. Fertilizers and Power have the lowest water recycling percentage, with only 20% of waste water recycle or reuse.
It would be encouraging to see companies improving their transparency when it comes to reporting these numbers.
Lack of transparency will affect the company’s credibility and pull down their ESG data sets and scores based on the sectors they operate.
SHOULD THE GLOBAL POPULATION REACH 9.6 BILLION BY 2050, THE EQUIVALENT OF ALMOST THREE PLANETS COULD BE REQUIRED TO PROVIDE THE NATURAL RESOURCES NEEDED TO SUSTAIN CURRENT LIFESTYLES – UNITED NATIONS.
NO PLAN=NO IMPROVEMENT
Industry and Sector-wise statistics

Companies having a strategy to promote the use of recycled materials -Overall Industry Average
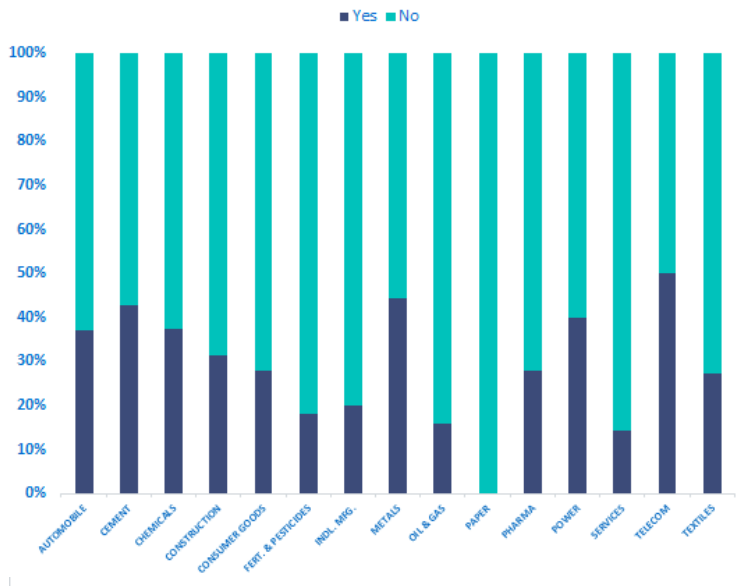
Low disclosures on recycling remain a bane, and existing disclosures do not paint a pretty picture. Without a plan, we cannot expect companies to improve resource use, and the absence of a strategy reduces the incentive to disclose, creating a vicious cycle.
Telecom, Metals, Cement, and Power account for almost 50% of companies having a strategy for reducing raw material use.
Regulation plays a pivotal role in improving water and waste management. For instance, the Centre for Pollution Control Board (CPCB) has been monitoring and penalizing firms for poor waste management, thereby accelerating the adoption of a plan. Central Government is enhancing regulation by amending the Plastic waste management rules, extending producers responsibility (EPR) where companies have to specify collection targets for plastics. The government is enacting laws mandating local bodies, gram panchayats other waste generators to manage waste responsibly.
Finally, BRSR reporting should help move the needle as companies must report their waste and water use numbers.

Download our free pdf for, Recycling Data Analysis and Waste Management.